Scenario 4 - A "cross offerings" use case
Problem statement#
As a data scientist, I need to extract insights from a large data set and create the related visualizations.
Goals#
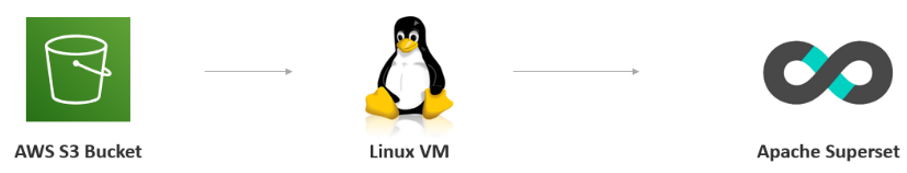
- Data are stored in a dedicated AWS S3 Bucket
- Load the data from the Linux VM and leverage the GPU capacity to perform complex analytics on the data
- Connect to Apache Superset to create the desired visualizations
Tools & Capabilities#
In order to meet the use case goals, the following tools from the portal will be leveraged:
| Tool | Description | Key capability |
|---|---|---|
| AWS S3 bucket | Object storage service offering scalability, data availability, security, and performance. | Storage |
| Linux VM | A Linux virtual machine is a virtual machine (VM) that is running a distribution of Linux as the guest operating system (guest OS). | Virtual Machine |
| Apache Superset | Apache Superset is a modern data exploration and visualization platform. It is fast, lightweight, intuitive, and loaded with options that make it easy for users of all skill sets to explore and visualize their data, from simple line charts to highly detailed geospatial charts. | Data Visualization |
Use case guide#
This document is meant to guide the user through Scenario 4 - A “cross offerings” use case. The guide will be a step-by-step tutorial towards such objective. Each subsection covers a step of the approach, namely:
- Data are stored in a dedicated AWS S3 Bucket. Open the terminal on the deployed Linux VM and using the AWS Command Line Interface (CLI), configure your AWS credentials using the "aws configure" command. You can then utilize commands such as "aws s3 ls" to list the contents of the S3 bucket and "aws s3 cp" to download data files from the S3 bucket to the Linux VM via terminal. Subsequently, you can employ the CLI to push the downloaded data files back to the designated S3 bucket using "aws s3 cp" or other appropriate commands.
- Leverage the GPU capacity of the Linux VM to perform complex analytics on the data. Harness the GPU capabilities of the deployed Linux VM by employing specialized libraries and frameworks like TensorFlow, PyTorch, or CUDA to perform intricate and resource-intensive data analytics tasks, enabling accelerated computations and enhancing the efficiency of complex data analyses.
- Connect to Apache Superset to create the desired visualizations. Access Apache Superset from the My Services section, log in using the provided credentials, and establish a connection to the relevant data source (e.g., PostgreSQL or other databases) within the Superset interface. This connection will enable you to create, customize, and visualize your data using a variety of chart types and visualization tools offered by Superset's intuitive interface.