Use-case Guide - Scenario 2 - Search Analytics#
This document is meant to guide the user through Scenario 2 - Search Analytics. As disussed in the use case description, the goal is to provide a search engine tool to query the dataset, enriching the results with some relevant data visualizations. The guide will be a step by step tutorial towards such objective. More in detail, each subsection covers a step of the approach, namely:
- Step 1: Initialize the resources.
- Step 2: Load the data.
- Step 3: Perform data queries and related visualizations.
Step 1: Initialize the resources#
As first step, the user should inizialize the required resources. More in particular, two instances should be launched: - ElasticSearch instance - Kibana instance
Initialize the ElasticSearch instance#
- Go on the Service Catalog section of the Portal.
- Click on the button Launch on the ElasticSearch badge.
- Assign a name to the instance and select a group from the ones available in the list.
- Select the default configuration.
- Copy the auto-generated password. This will be needed to access the instance in the later stage. (NB: Instance credentials are automatically saved and accessible on the My Data section of the portal).
- Launch the instance by clicking on the launch button.
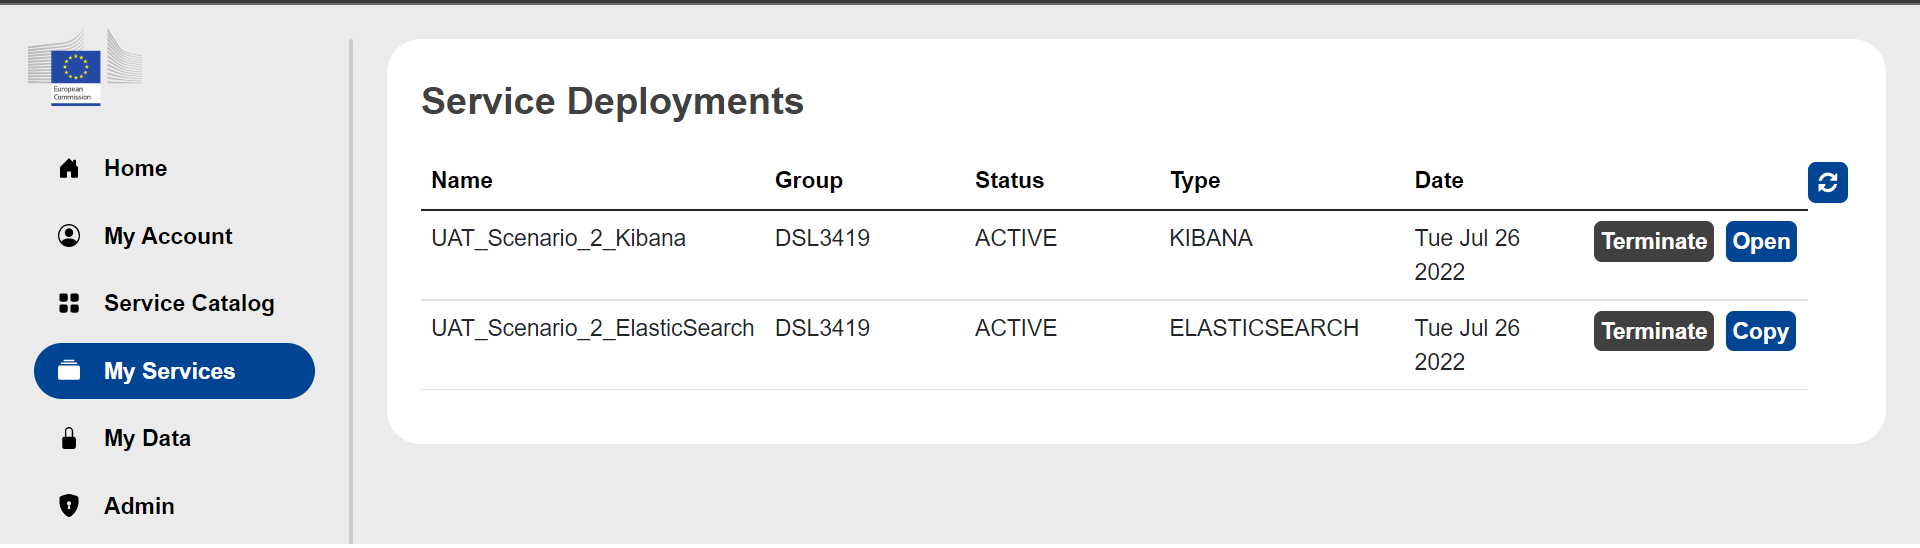
- Go on the My services section of the portal and wait for the ElasticSearch instance to be in the active state.
- Click the "Copy" button for the ElasticSearch instance just created. This will copy in your clipboard the host address for the instance.
Initialize the Kibana instance#
- Go on the Service Catalog section of the Portal.
- Click on the button Launch on the Kibana badge.
- Assign a name to the instance and select a group from the ones available in the list.
- Select the default configuration.
- Copy paste the Elasticsearch Host (see point 8 of previous step). Make sure that the Elasticsearch Host is written in the following way:
http://xxx.yy.zzz:9200
- Input the Elasticsearch password (see point 5 of previous step)
- Launch the instance by clicking on the launch button.
After having launch the instances, go on the My Services section of the portal to verify that all the deployed services are up and running (all three instances should be in status ACTIVE).
Step 2: Load the data and create the index#
- Download the data source csv file from here
- Go on the self service portal > My Services and open the Kibana instance. This will redirect you on the Kibana instance page.
- Login to the Kibana instance with the access credentials defined in the previous step.
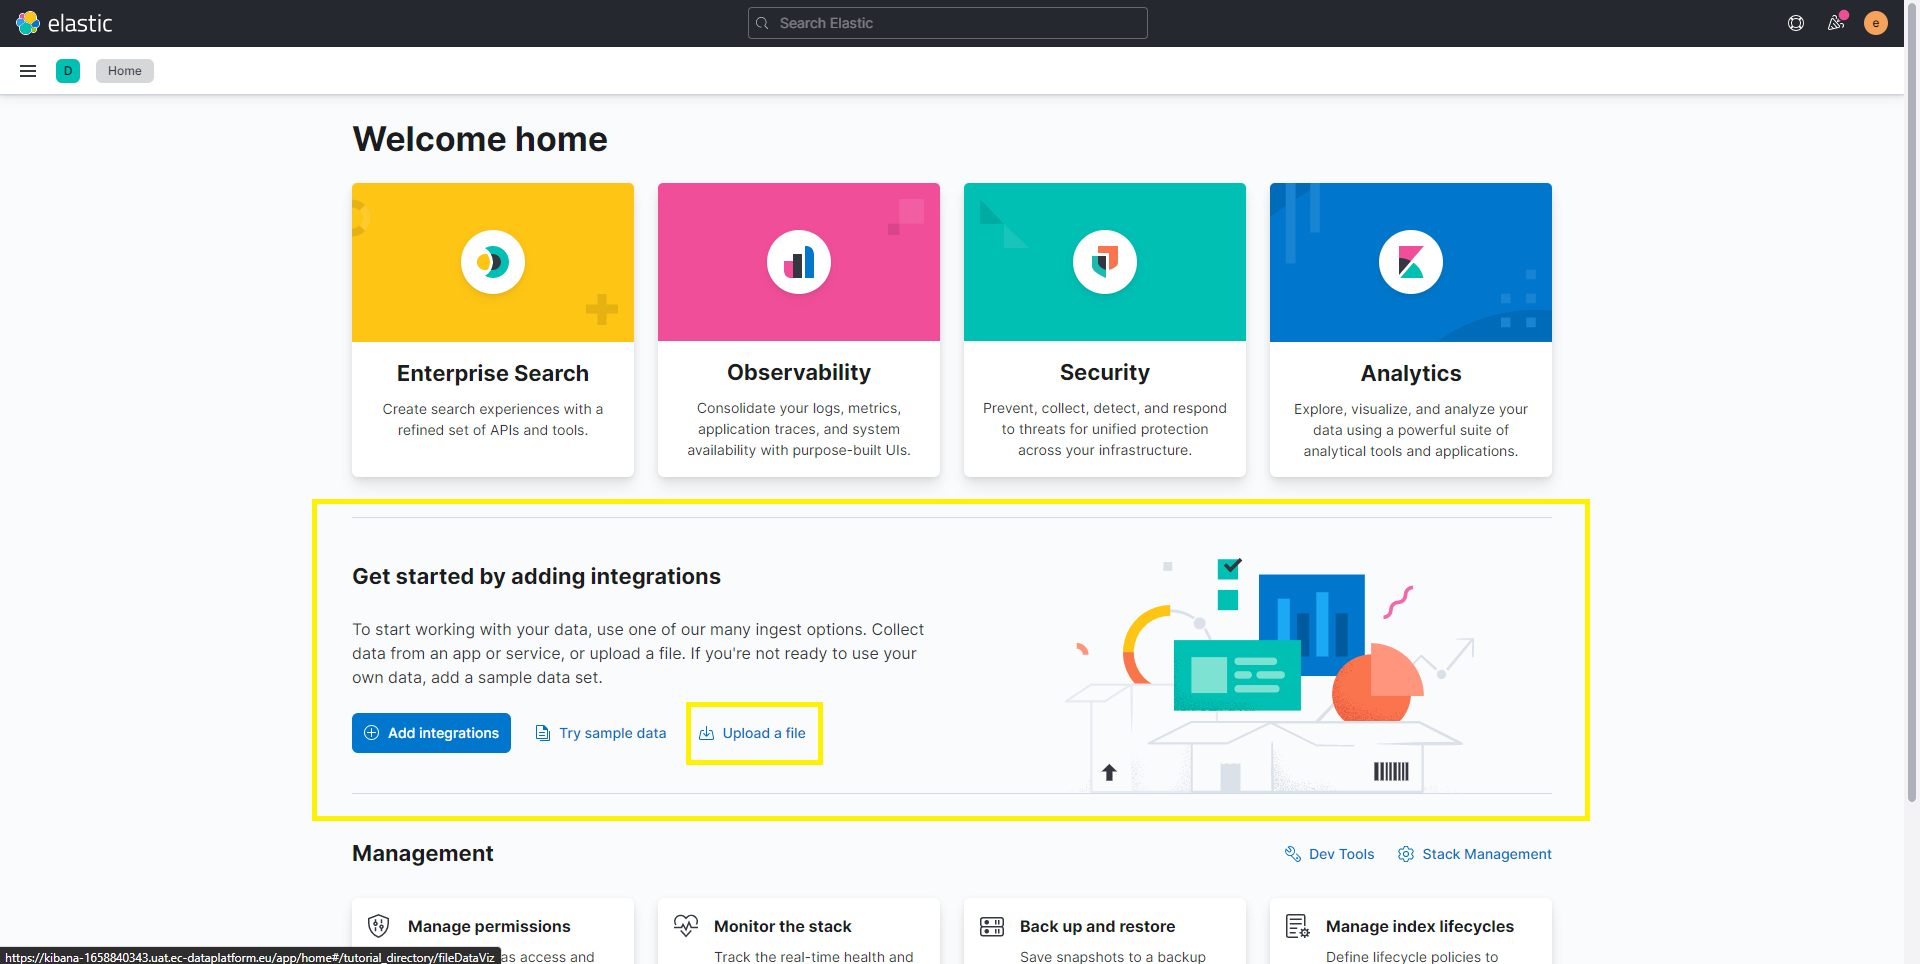
- On the home page, go on the section "Get started by adding integrations" and click on Upload a file.
- Click on Select or drag and drop a file and select the downloaded dataset.
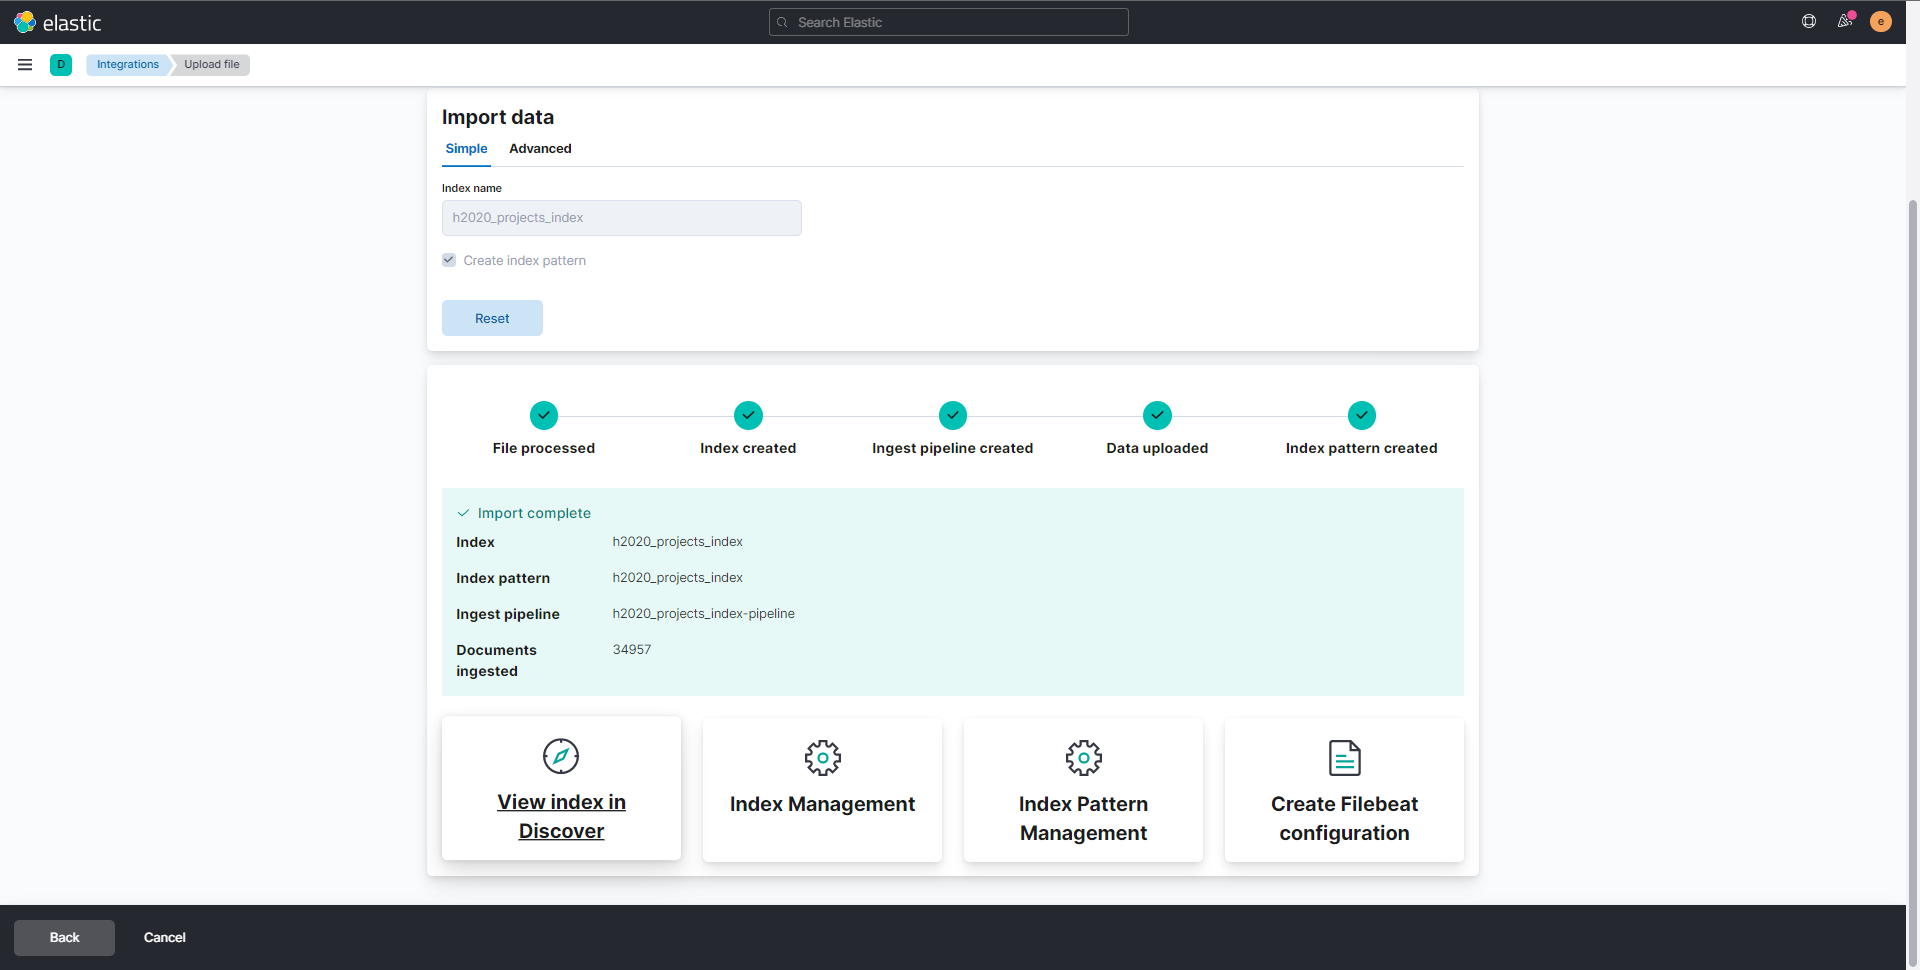
- If the file is successfully uploaded, you should see an overview including file contents, file summary and file stats.
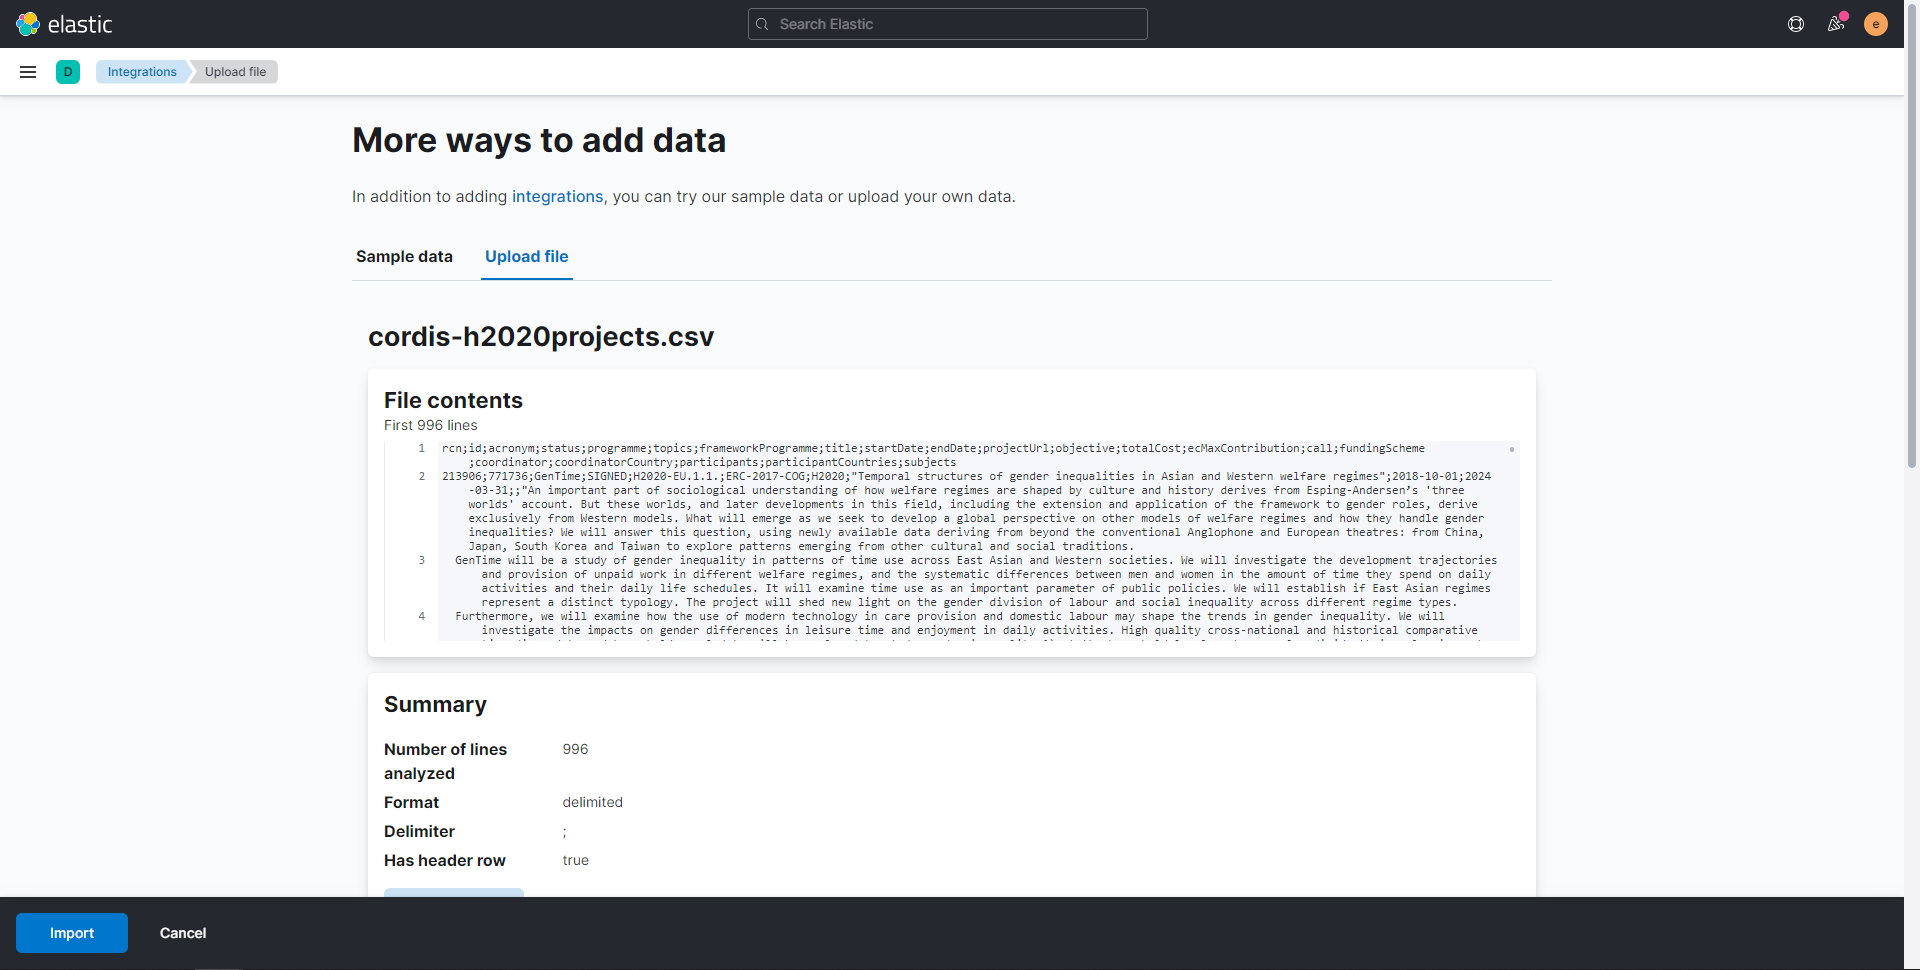
Thus, click on the Import button. 7. Define an index name (i.e. cordis-h2020projects) and tick the Create index pattern option. Thus, click on the Import button. 8. Wait for the process to be done and click on View Index in Discover.
Step 3: Perform data queries and related visualizations#
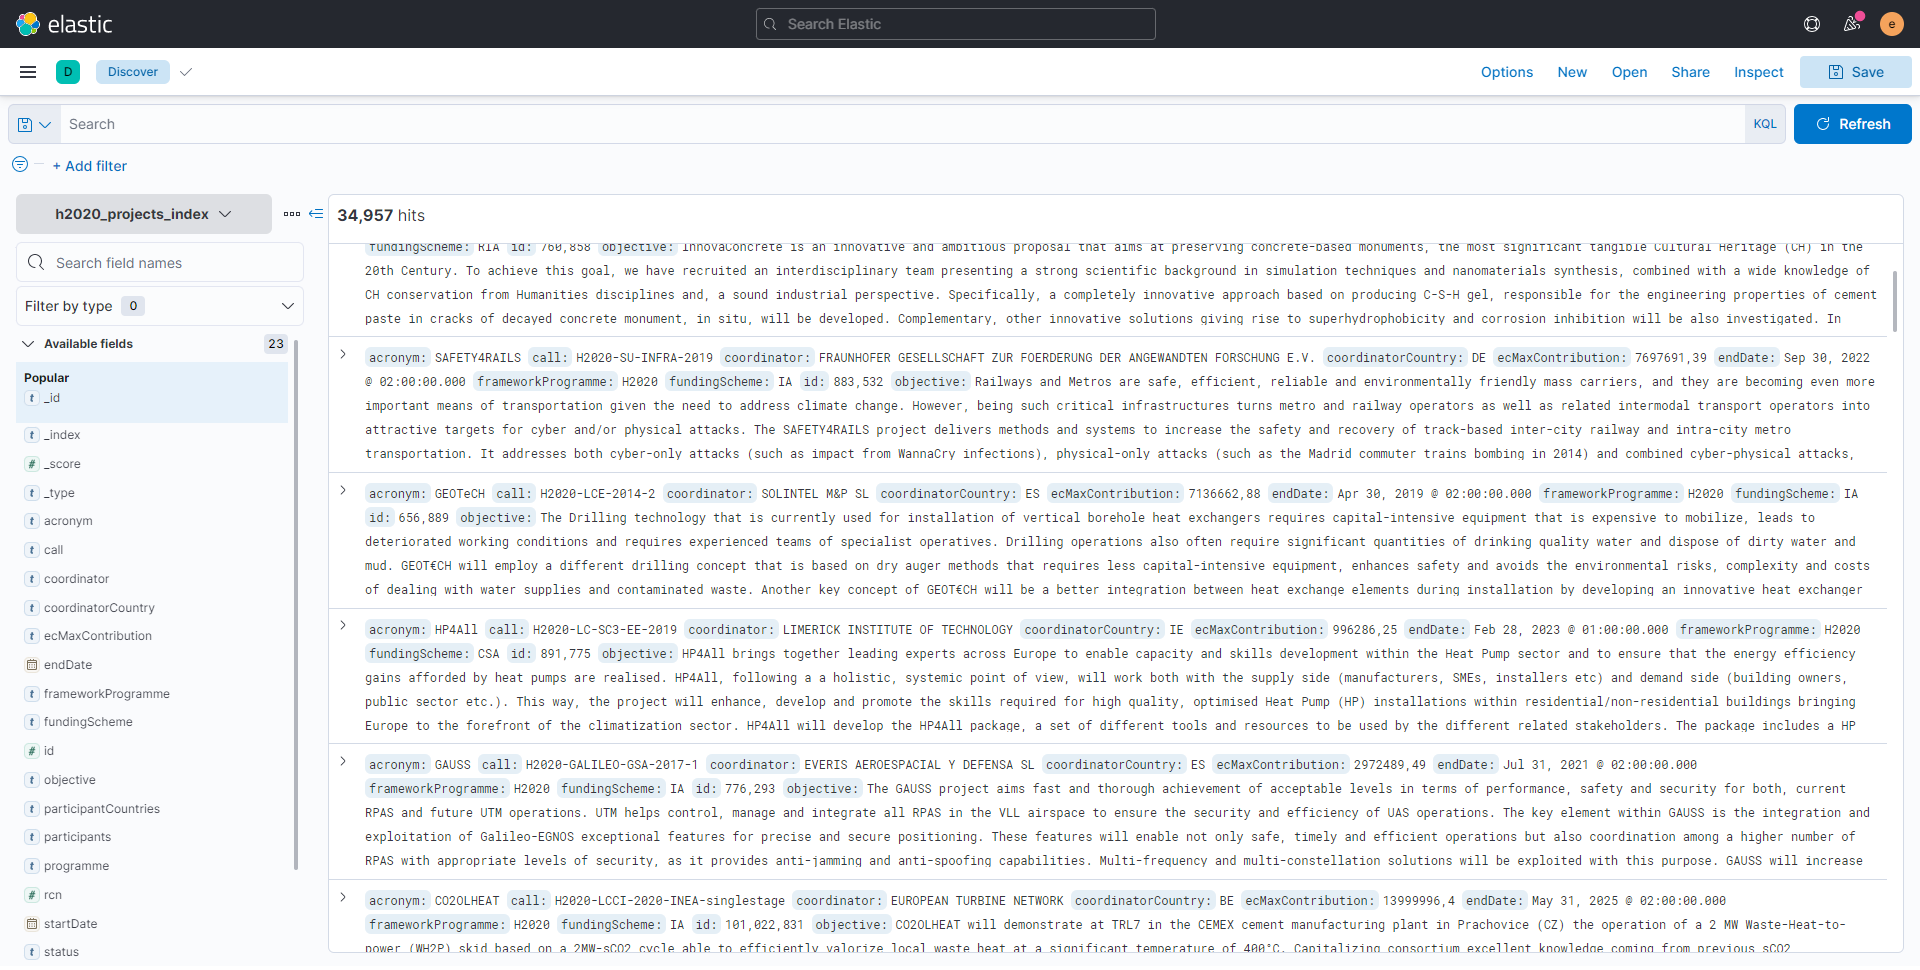
The data indexing performed at step 2 created a search index for the uploaded data. In turn, this allows to perform query toward the data and to extract visualizations from the results. This can be done directly from the Discover function of Kibana:
To depict the uses and potentiality of such tool, an example query and visualization is reported here.
Query: Sustainability and Open-source projects#
Objectives:#
- To individuate the h2020 projects related to sustainability and in which open-source features are mentioned.
- To gather visual insights from the data.
Objective 1: Query the data#
- In the Search bar, input "sustainability" and "open source". Click on the update button.
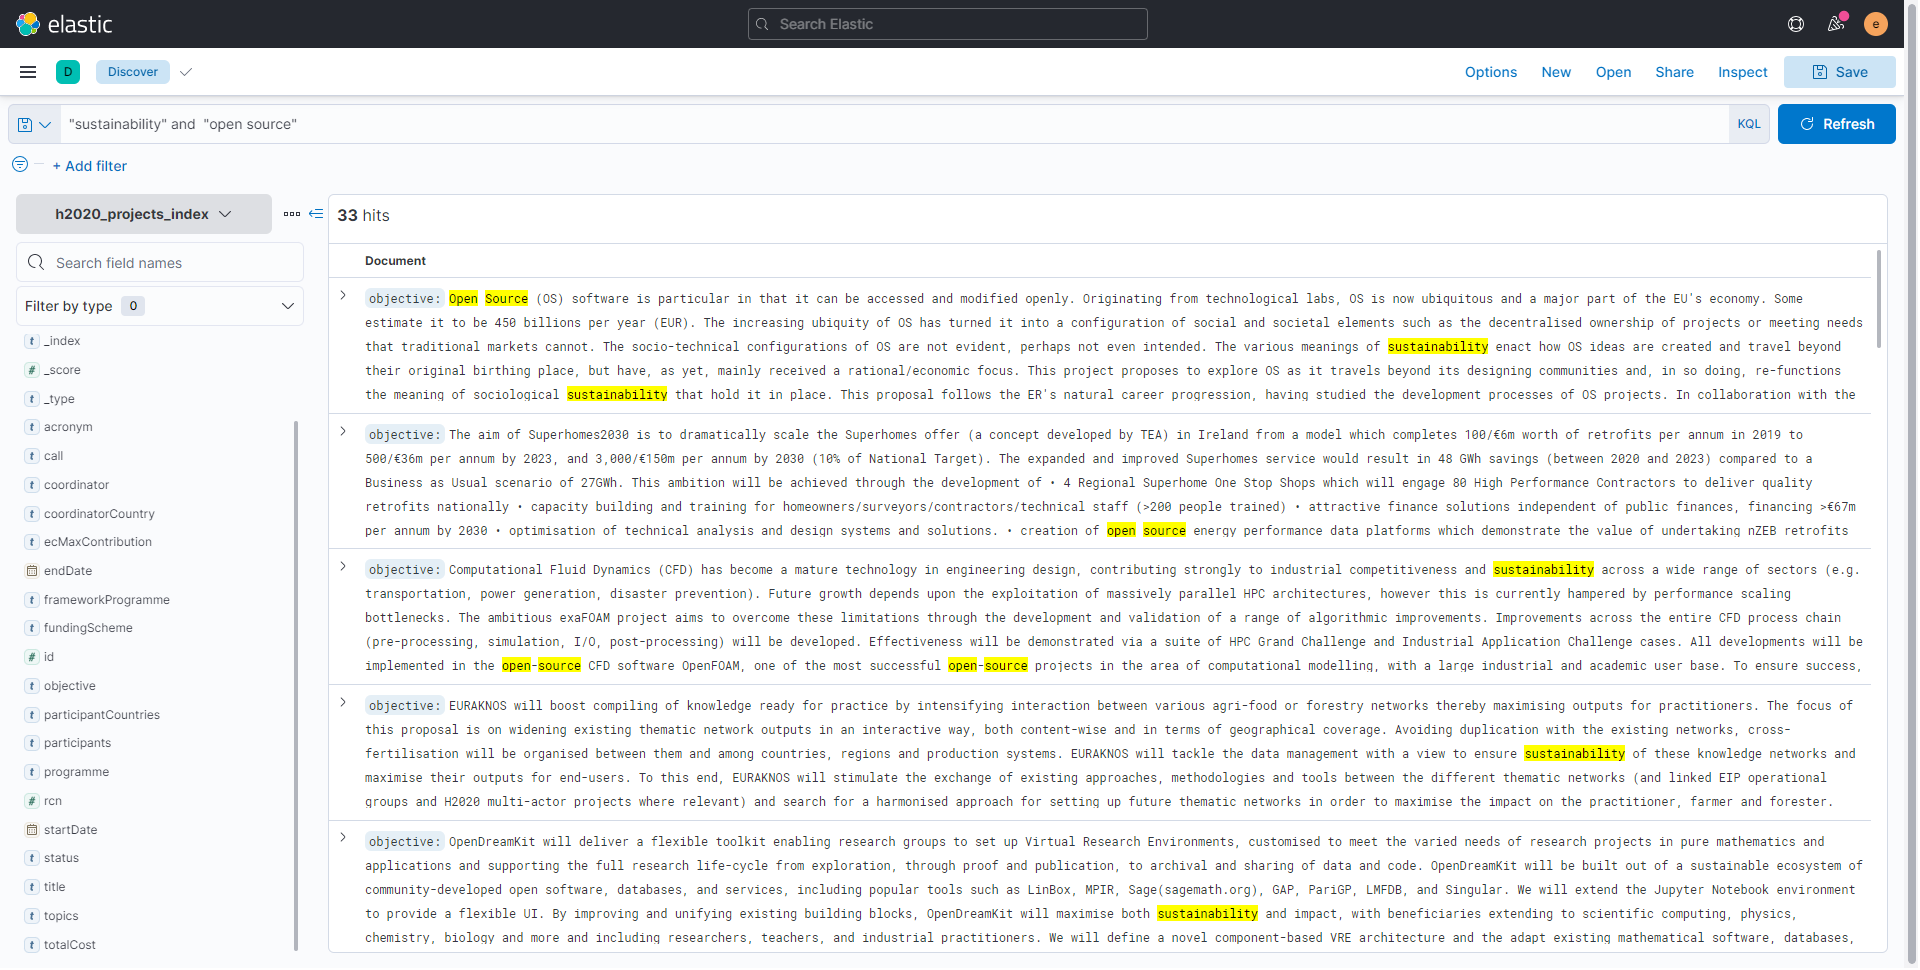
This will show only the research records that contain the specified keywords. 2. When browsing on the Available fields on the left, the user can easily access information of each field (for the retrieved results) by just clicking on the field name. For example, by clicking on the Coordinator field, the top 5 coordinators for the projects in the results are showed.
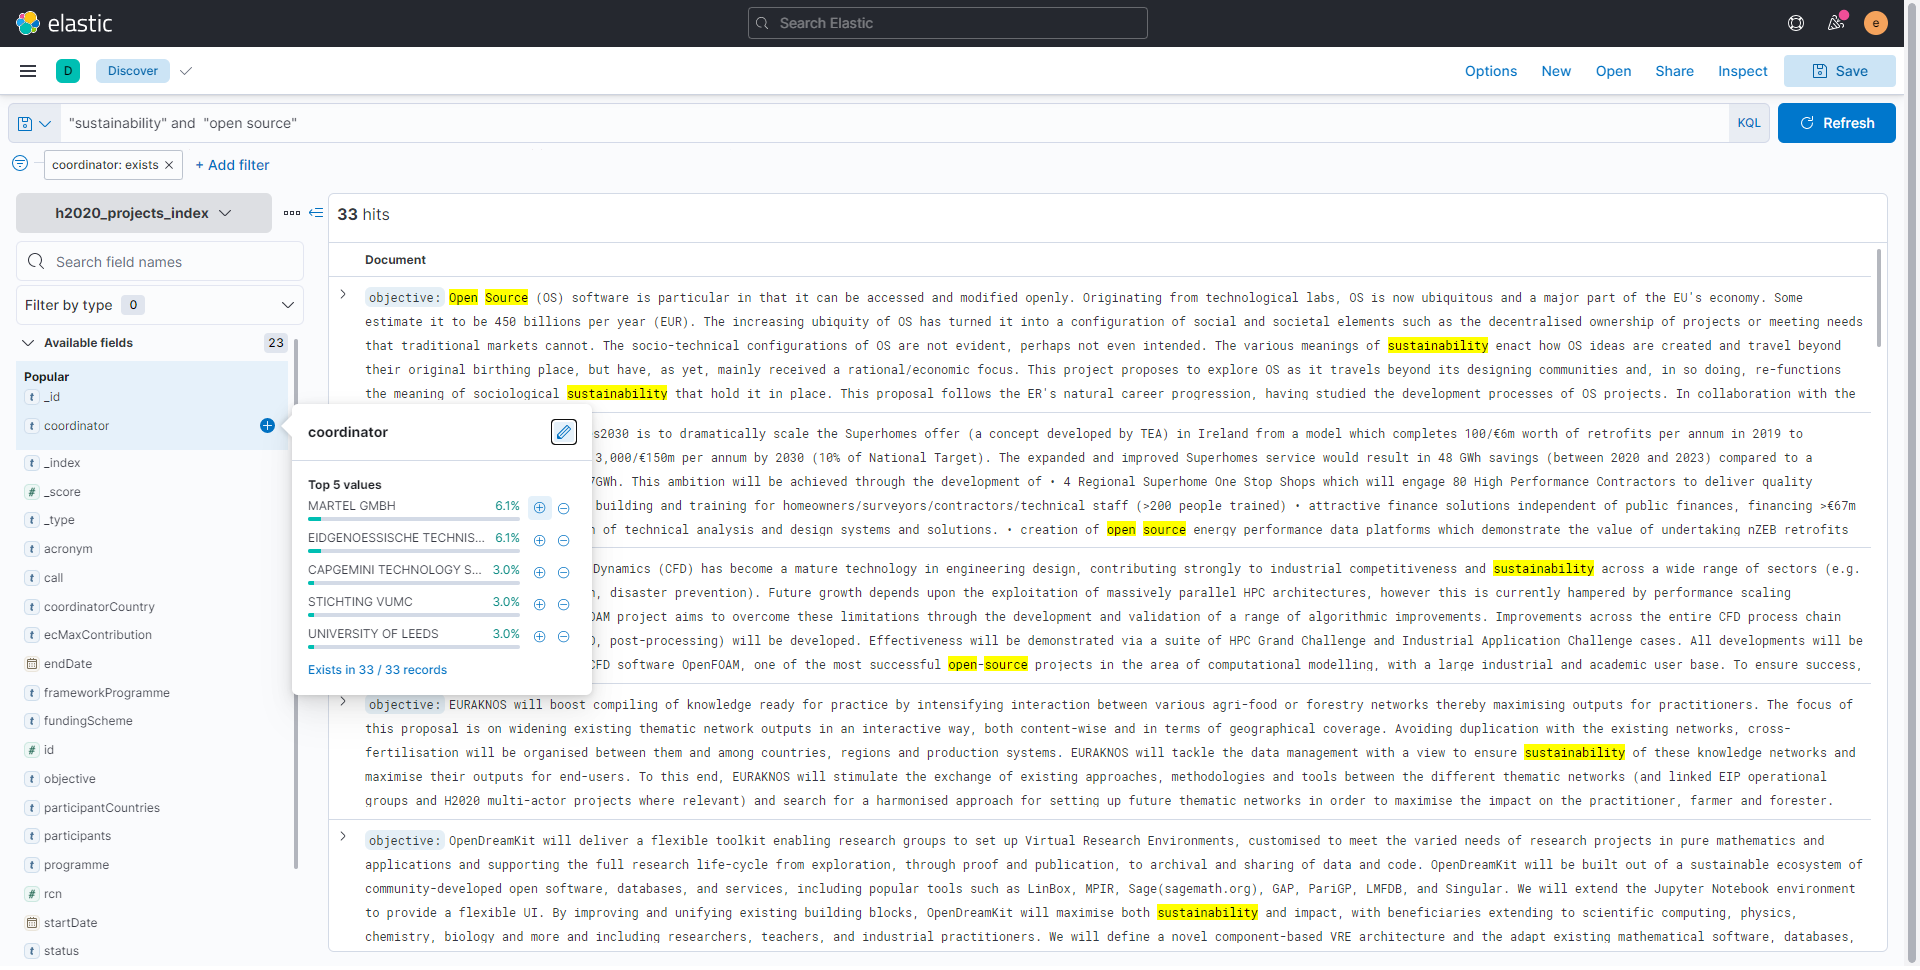
- Results obtained can be further filtered by adding a filter. This can be done by clicking on + Add filter. It is also possible to quickly filter out results for a specific field value by clicking on the "+" button next to the value we want to set as filter. For example, by clicking on the "+" button next to the MARTEL GMBH value, only projects having MARTEL GMBH as coordinator will be showed.
- Is it also possible to filter out Available fields by filtering on the field type:
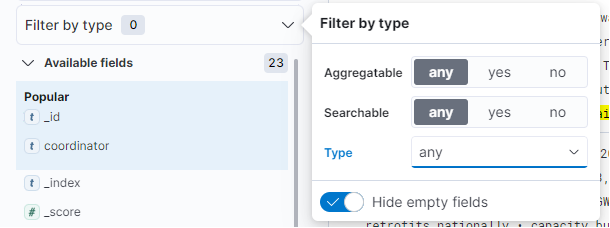
- It is fair to note that ElasticSearch support complex queries as well. That is to say that it is possible to look for a generic statement and the search engine will provide results which are correlated to the inputed sentence. For instance, these are the results of the following complex query:
mobility and sustainability projects should take into consideration policy making and relevant externalities that could act as constraints
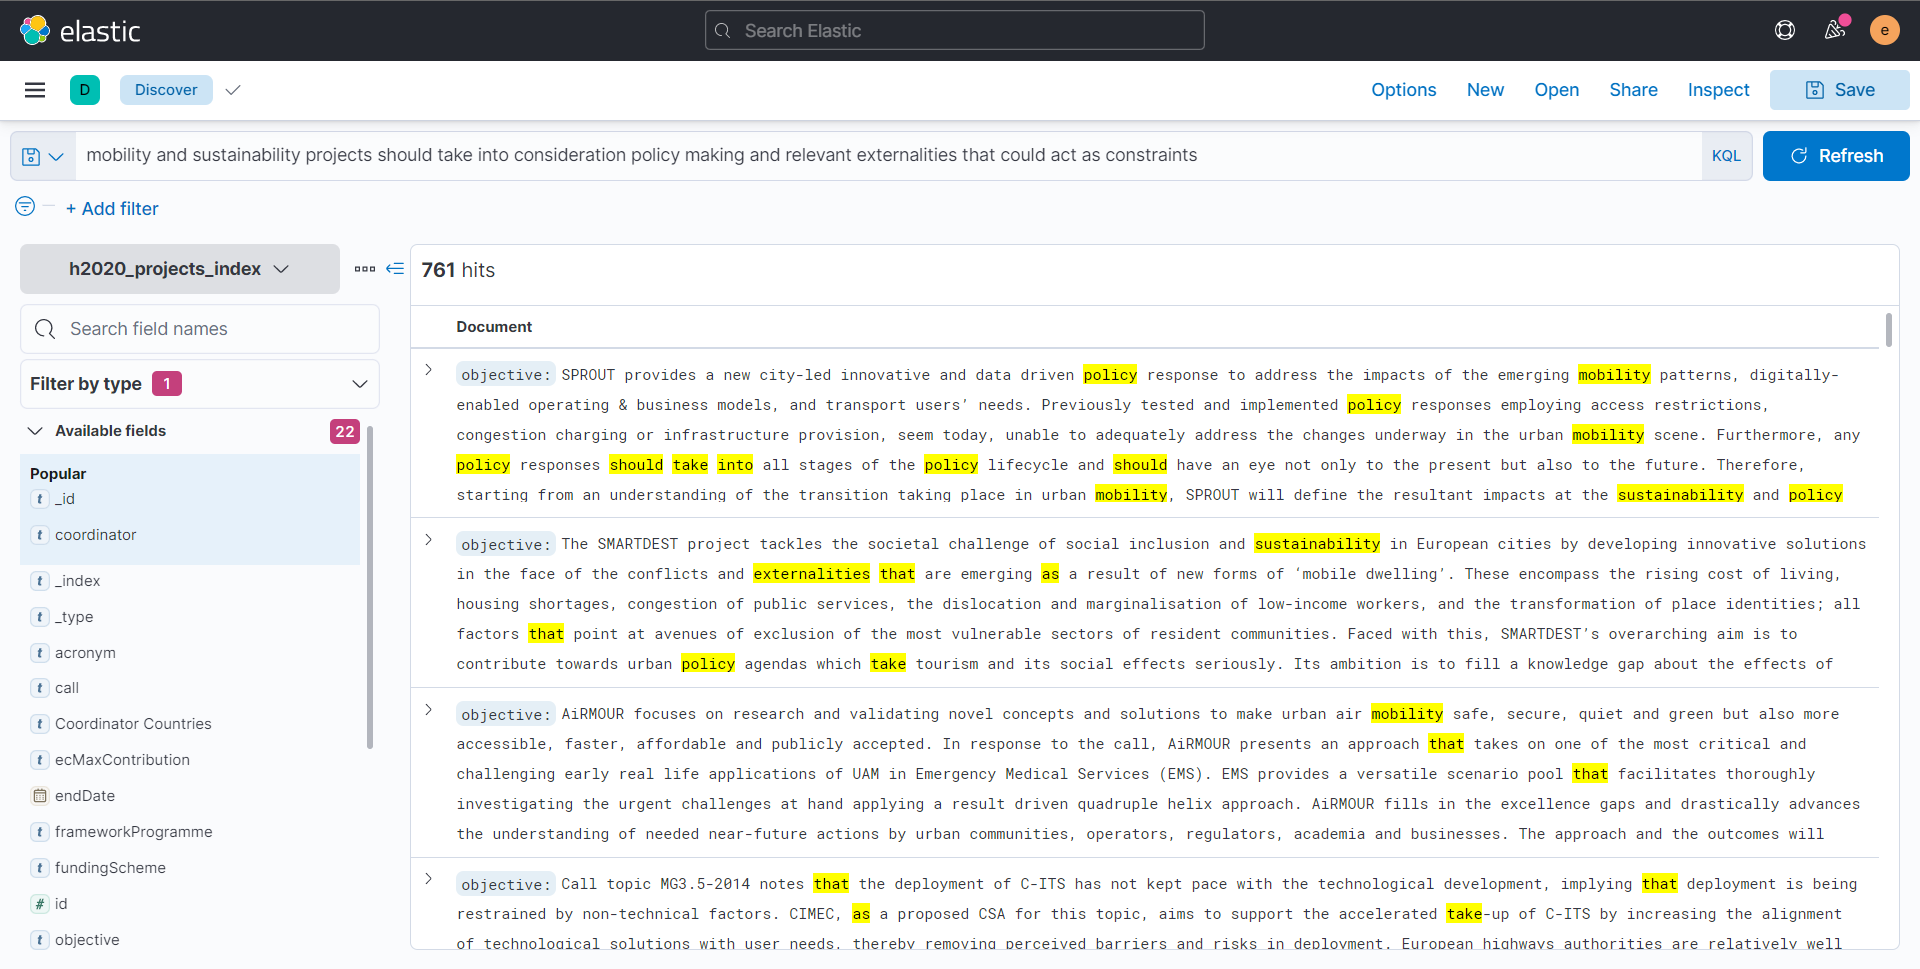
To optimize results, only searchable fields have been considered in the query (by setting the dedicated fields' filter).
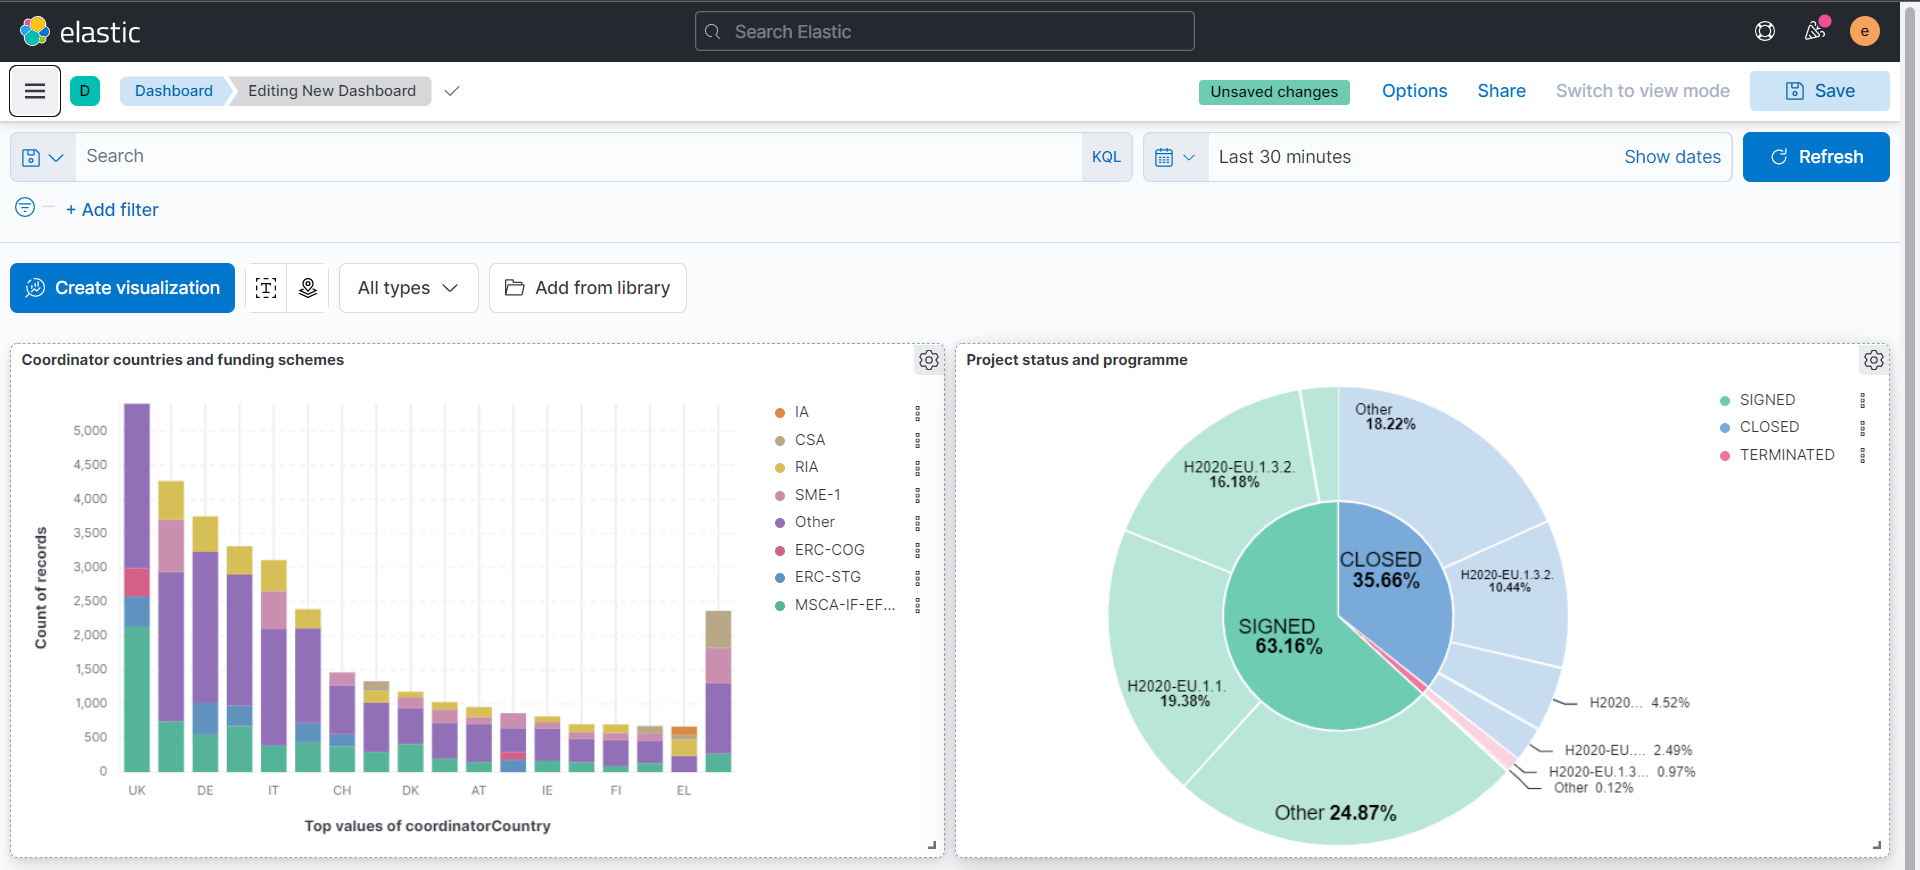
Objective 2: Create a dashboard#
- In the home page, click on the Analytics badge.
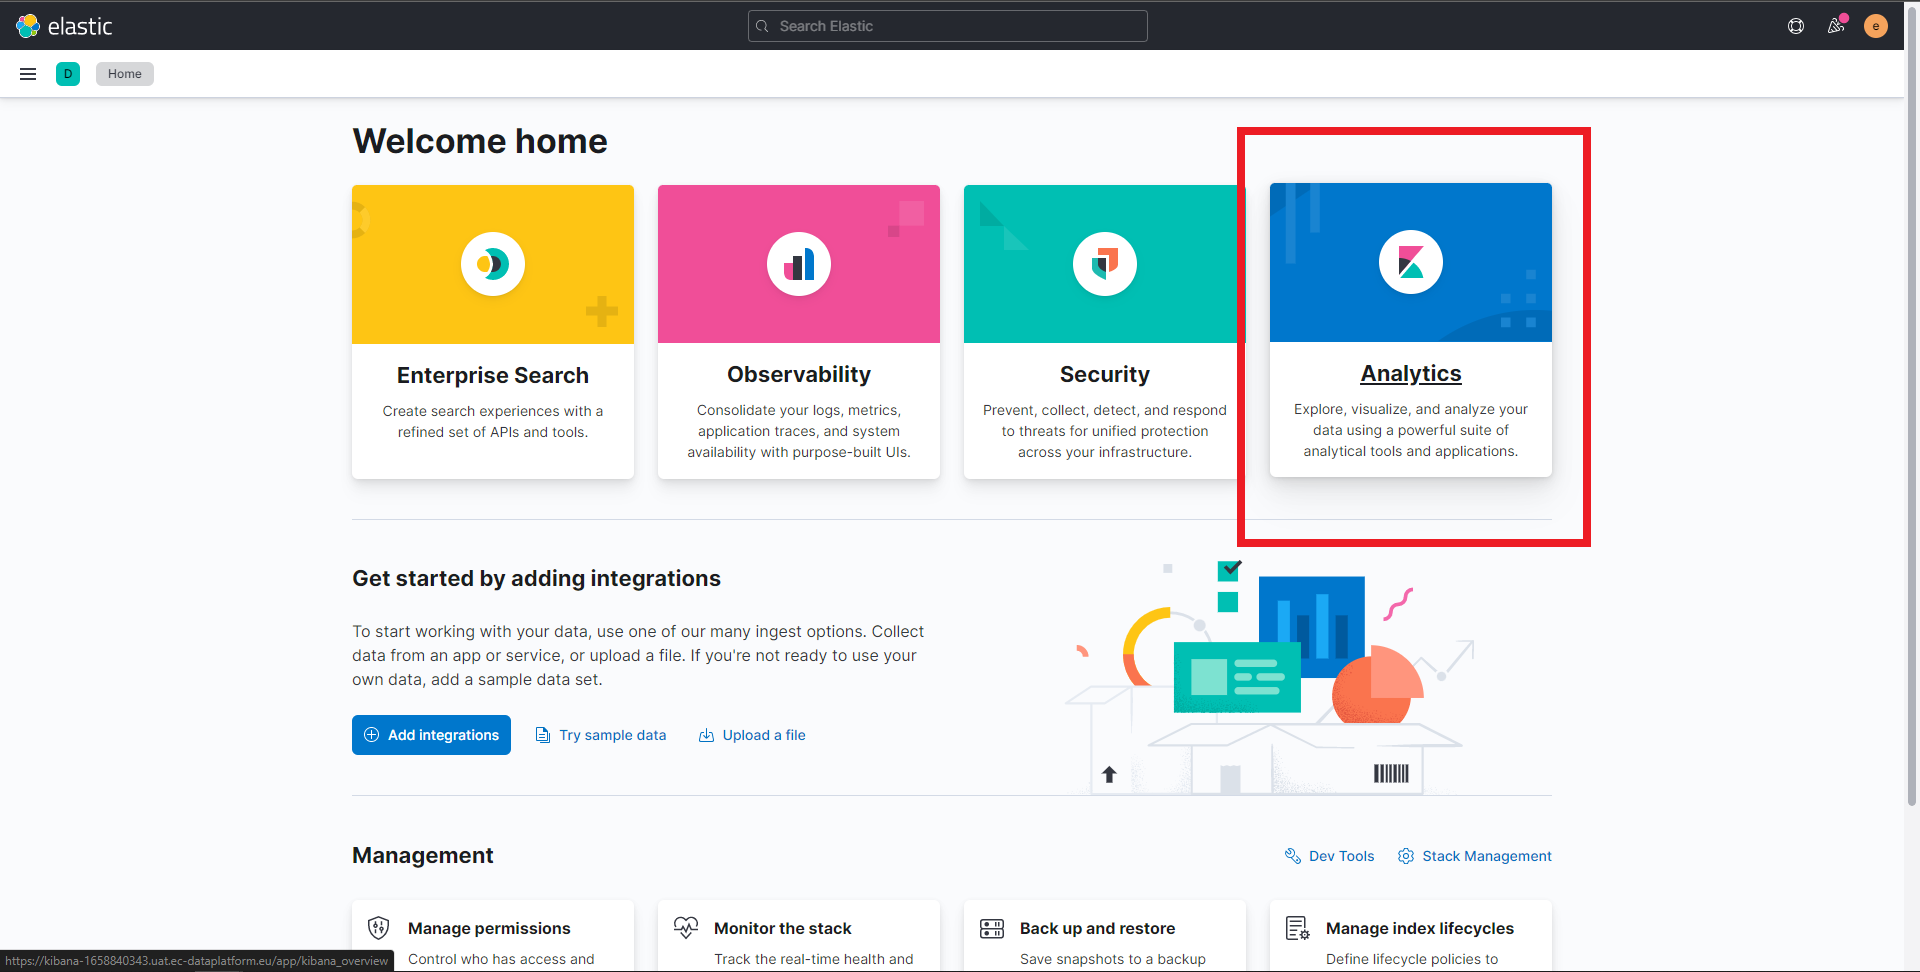
- Click on Dashboard.
- Click on Create new dashboard.
- Click on Create visualization. A set of example visualizations is reported:
Visualization 1: Coordinator countries and funding schemes
- Drag and drop the fields coordinatorCountry and fundingScheme. In this way, it will be displayed which are the country that coordinates the most projects and on which funding scheme these mainly rely on:
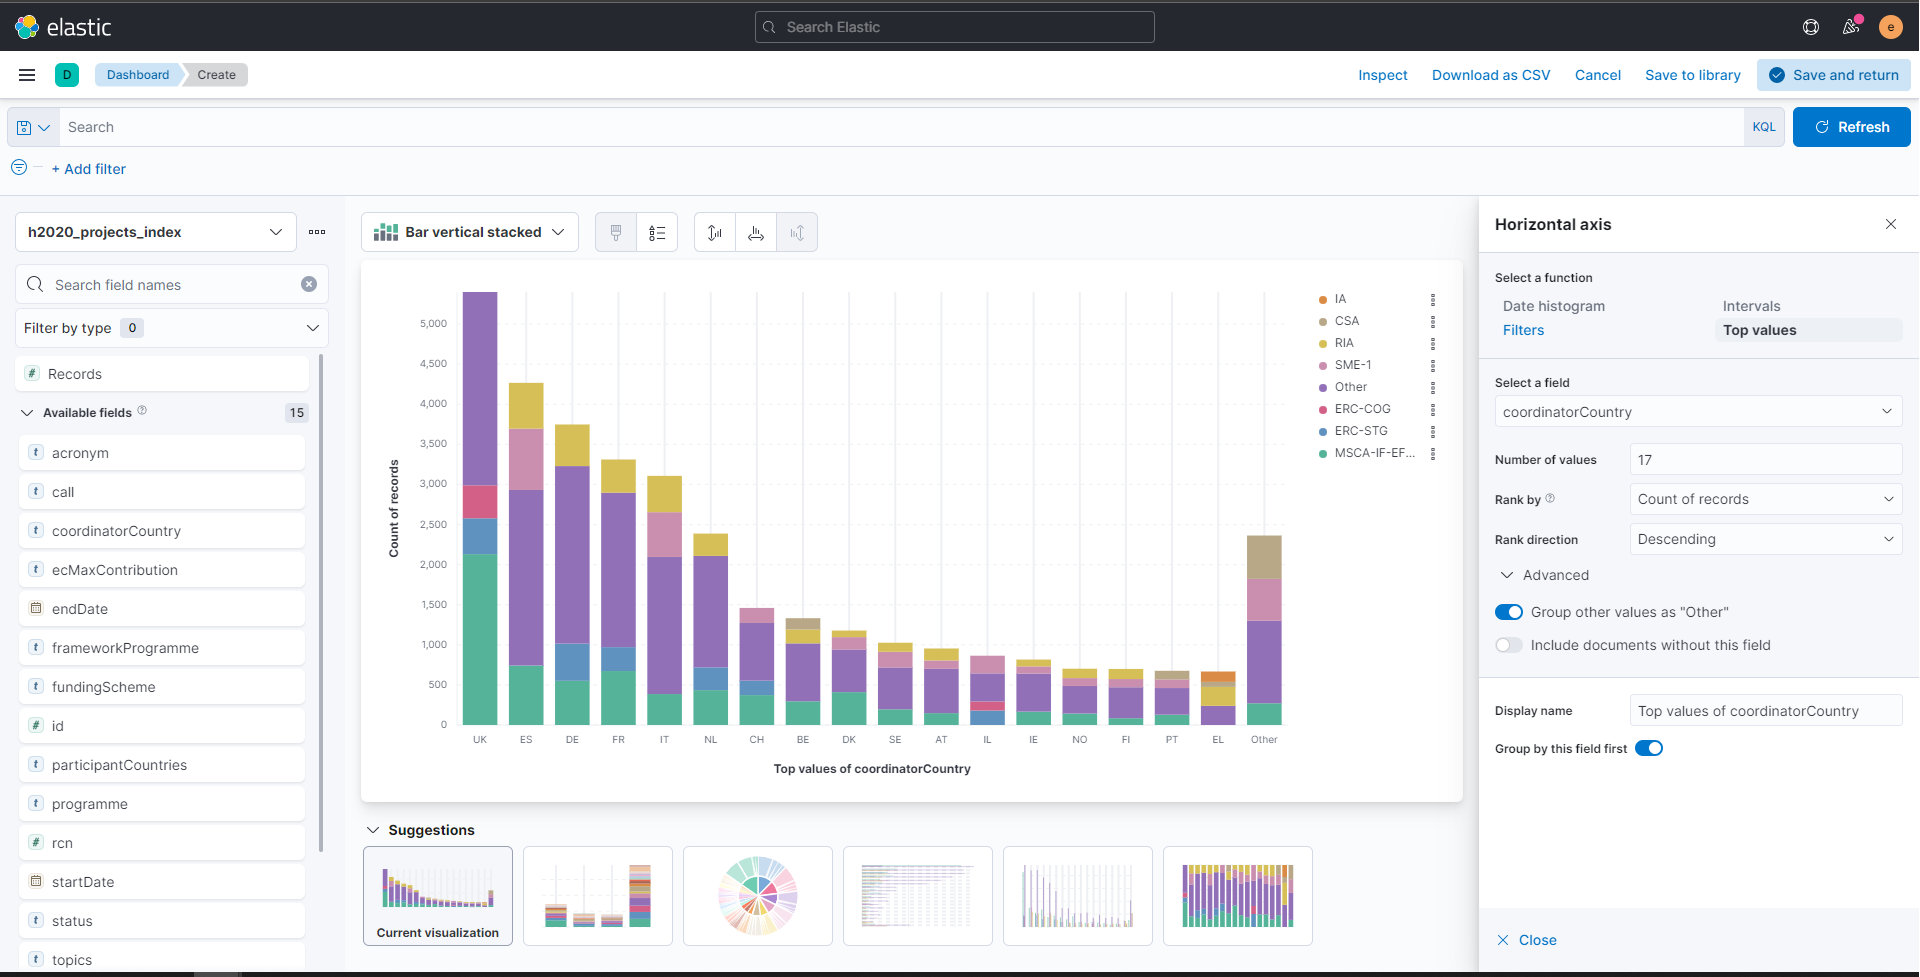
- Please note that it is possible to select the desired type of chart by just selecting it from the list above the current chart.
- Click on Save and return on the top-right of the screen.
- You can asign a title to the newly created visualization by editing the text [No Title] on the top of it.
Visualization 2: Status of researches based on programmes
- Drag and drop the fields status and programme. In this way, it will be displayed what is the distribution of project status (signed, closed, terminated) in relation to its programme.
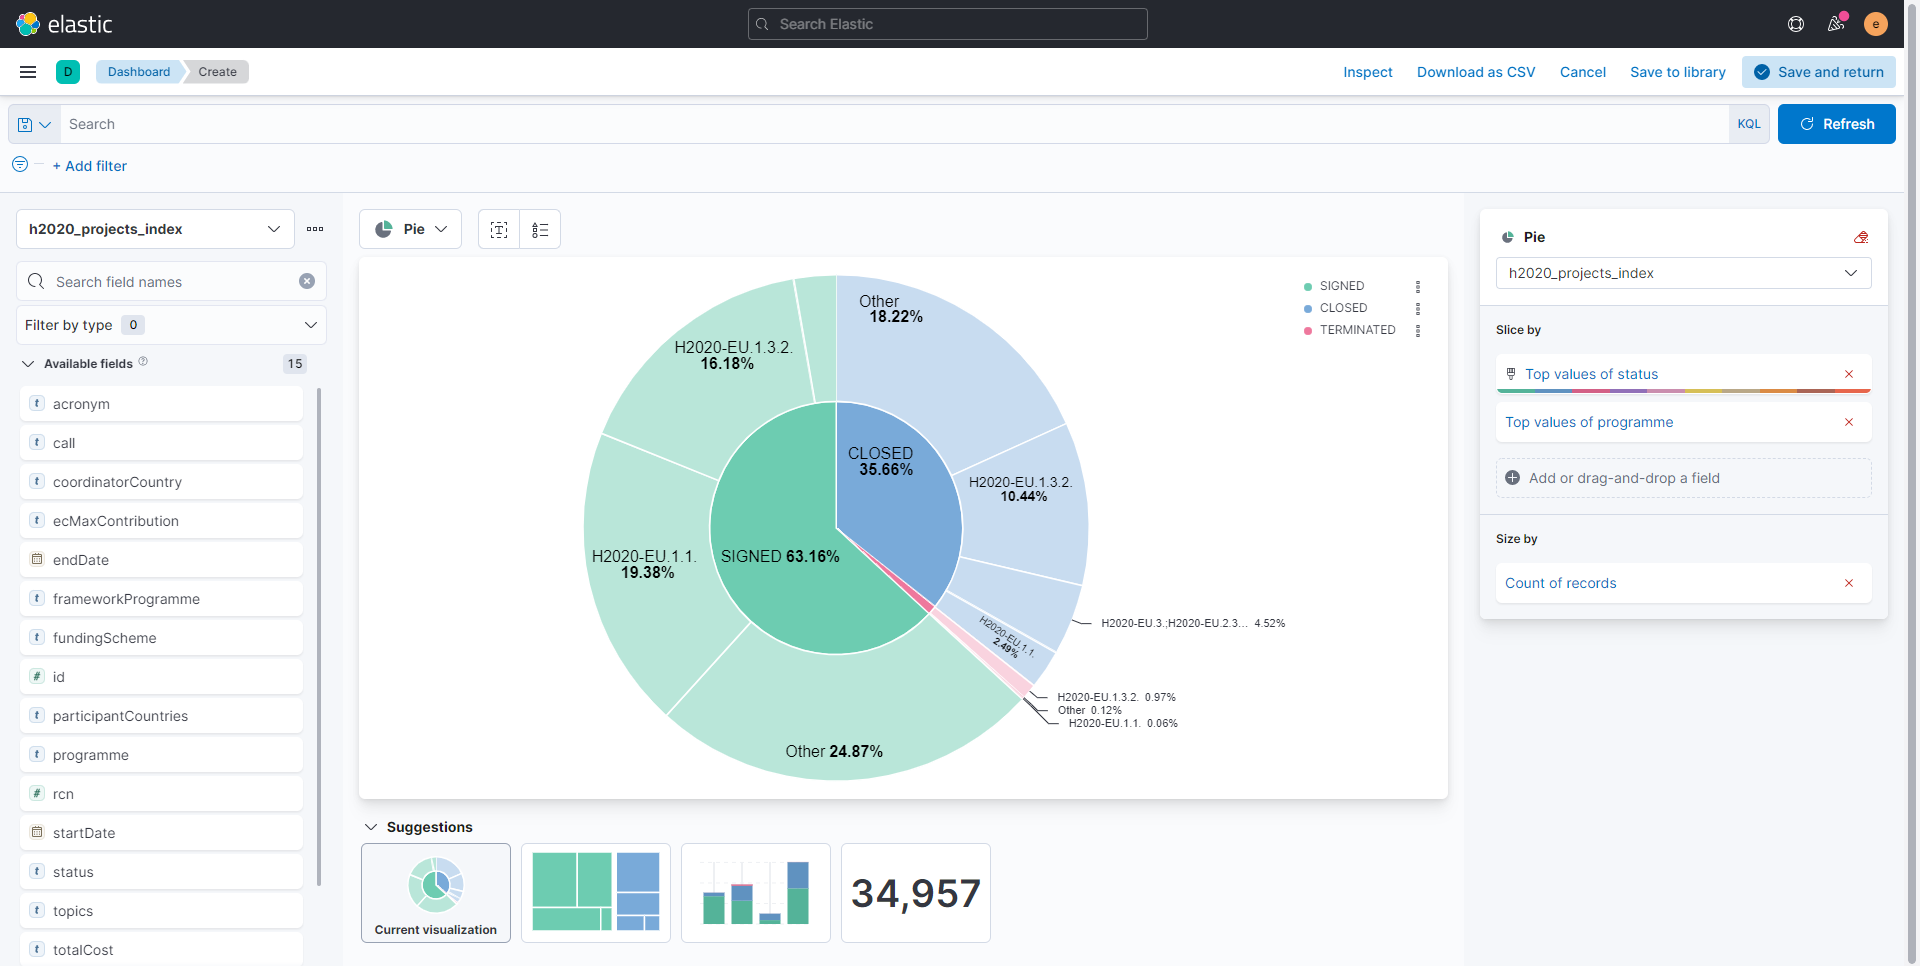
- Please note that it is possible to select the desired type of chart by just selecting it from the list above the current chart.
- Click on Save and return on the top-right of the screen.
- You can asign a title to the newly created visualization by editing the text [No Title] on the top of it.
Overview of the created dashboard: